
To fund Scarcity Zero’s target cost of $6.5 trillion over a ten-year period, this model suggests several reallocations of federal spending, alongside certain revenue raising approaches, to obtain the necessary revenue to implement the framework in the manner proposed. As with this model as a whole, these approaches will not be inherently partisan or politically ideological, and will rather reflect a good faith analysis under the assumption that our society, in turn, can get to a place where its leadership and social frameworks can operate under such faith. Further, this model will primarily look to aspects of the public sector at the federal level alone, and will make assumptions of private investment capabilities and consumer spending based on certain percentages of American Gross Domestic Product (GDP).
To begin, we’ll start with the federal budget, FY2018, using figures sourced from the Congressional Budget Office.[1]
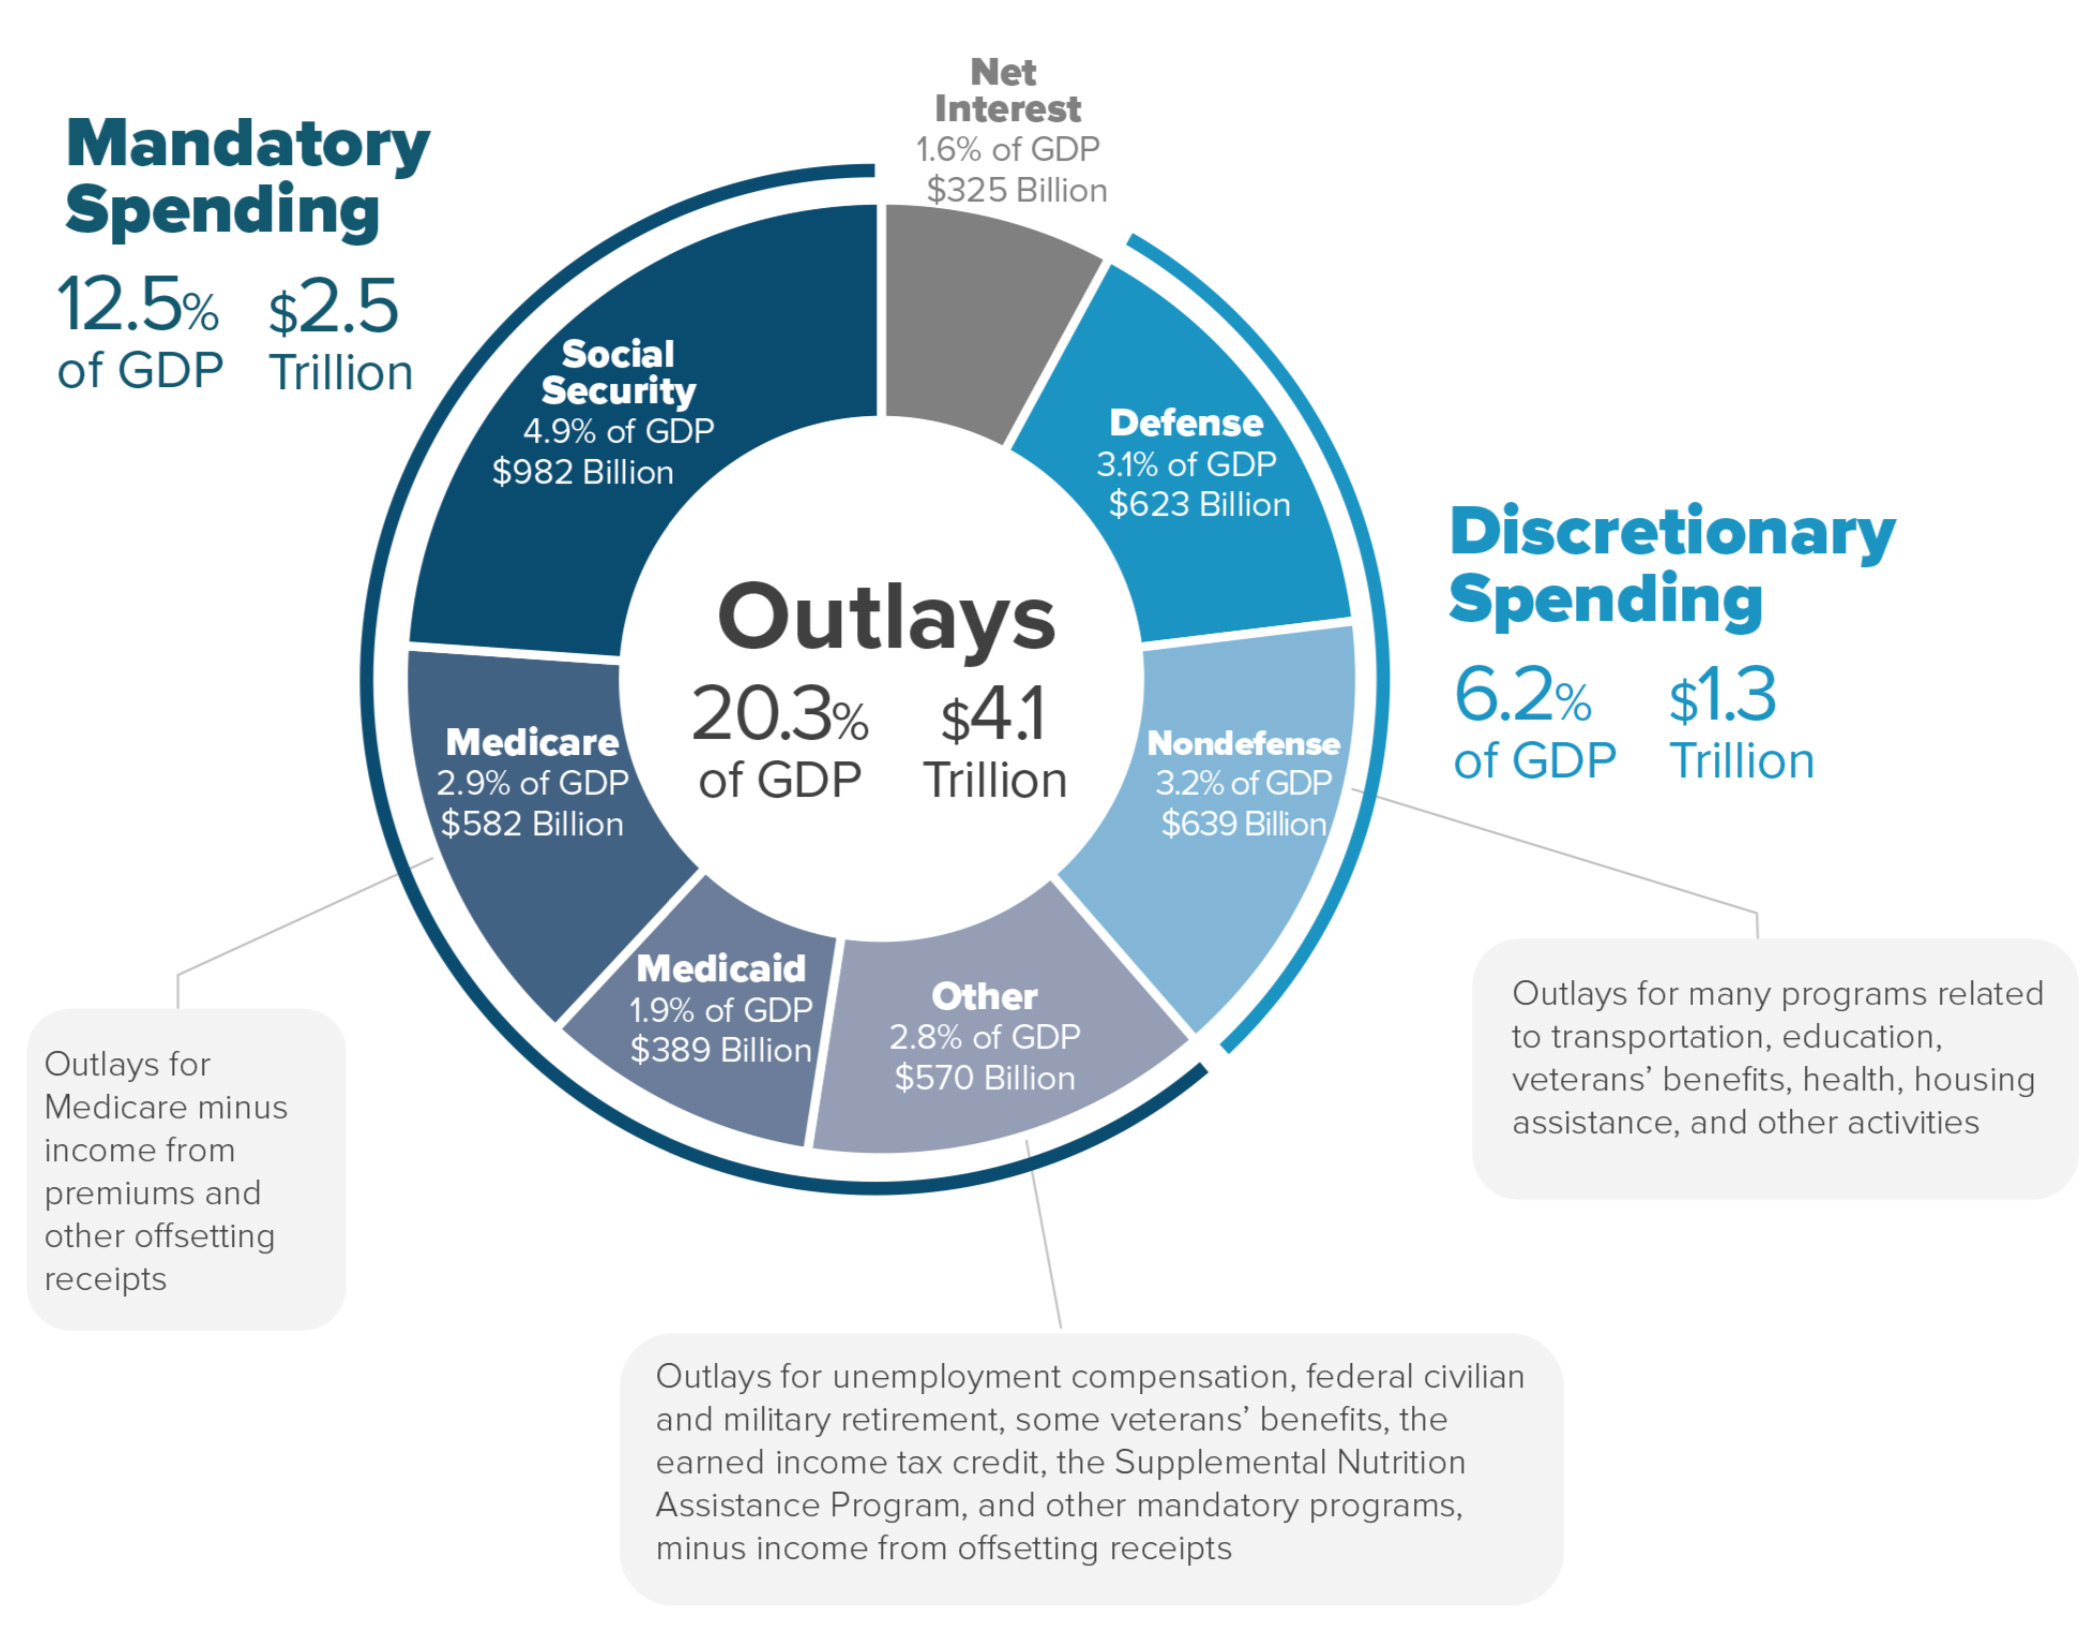
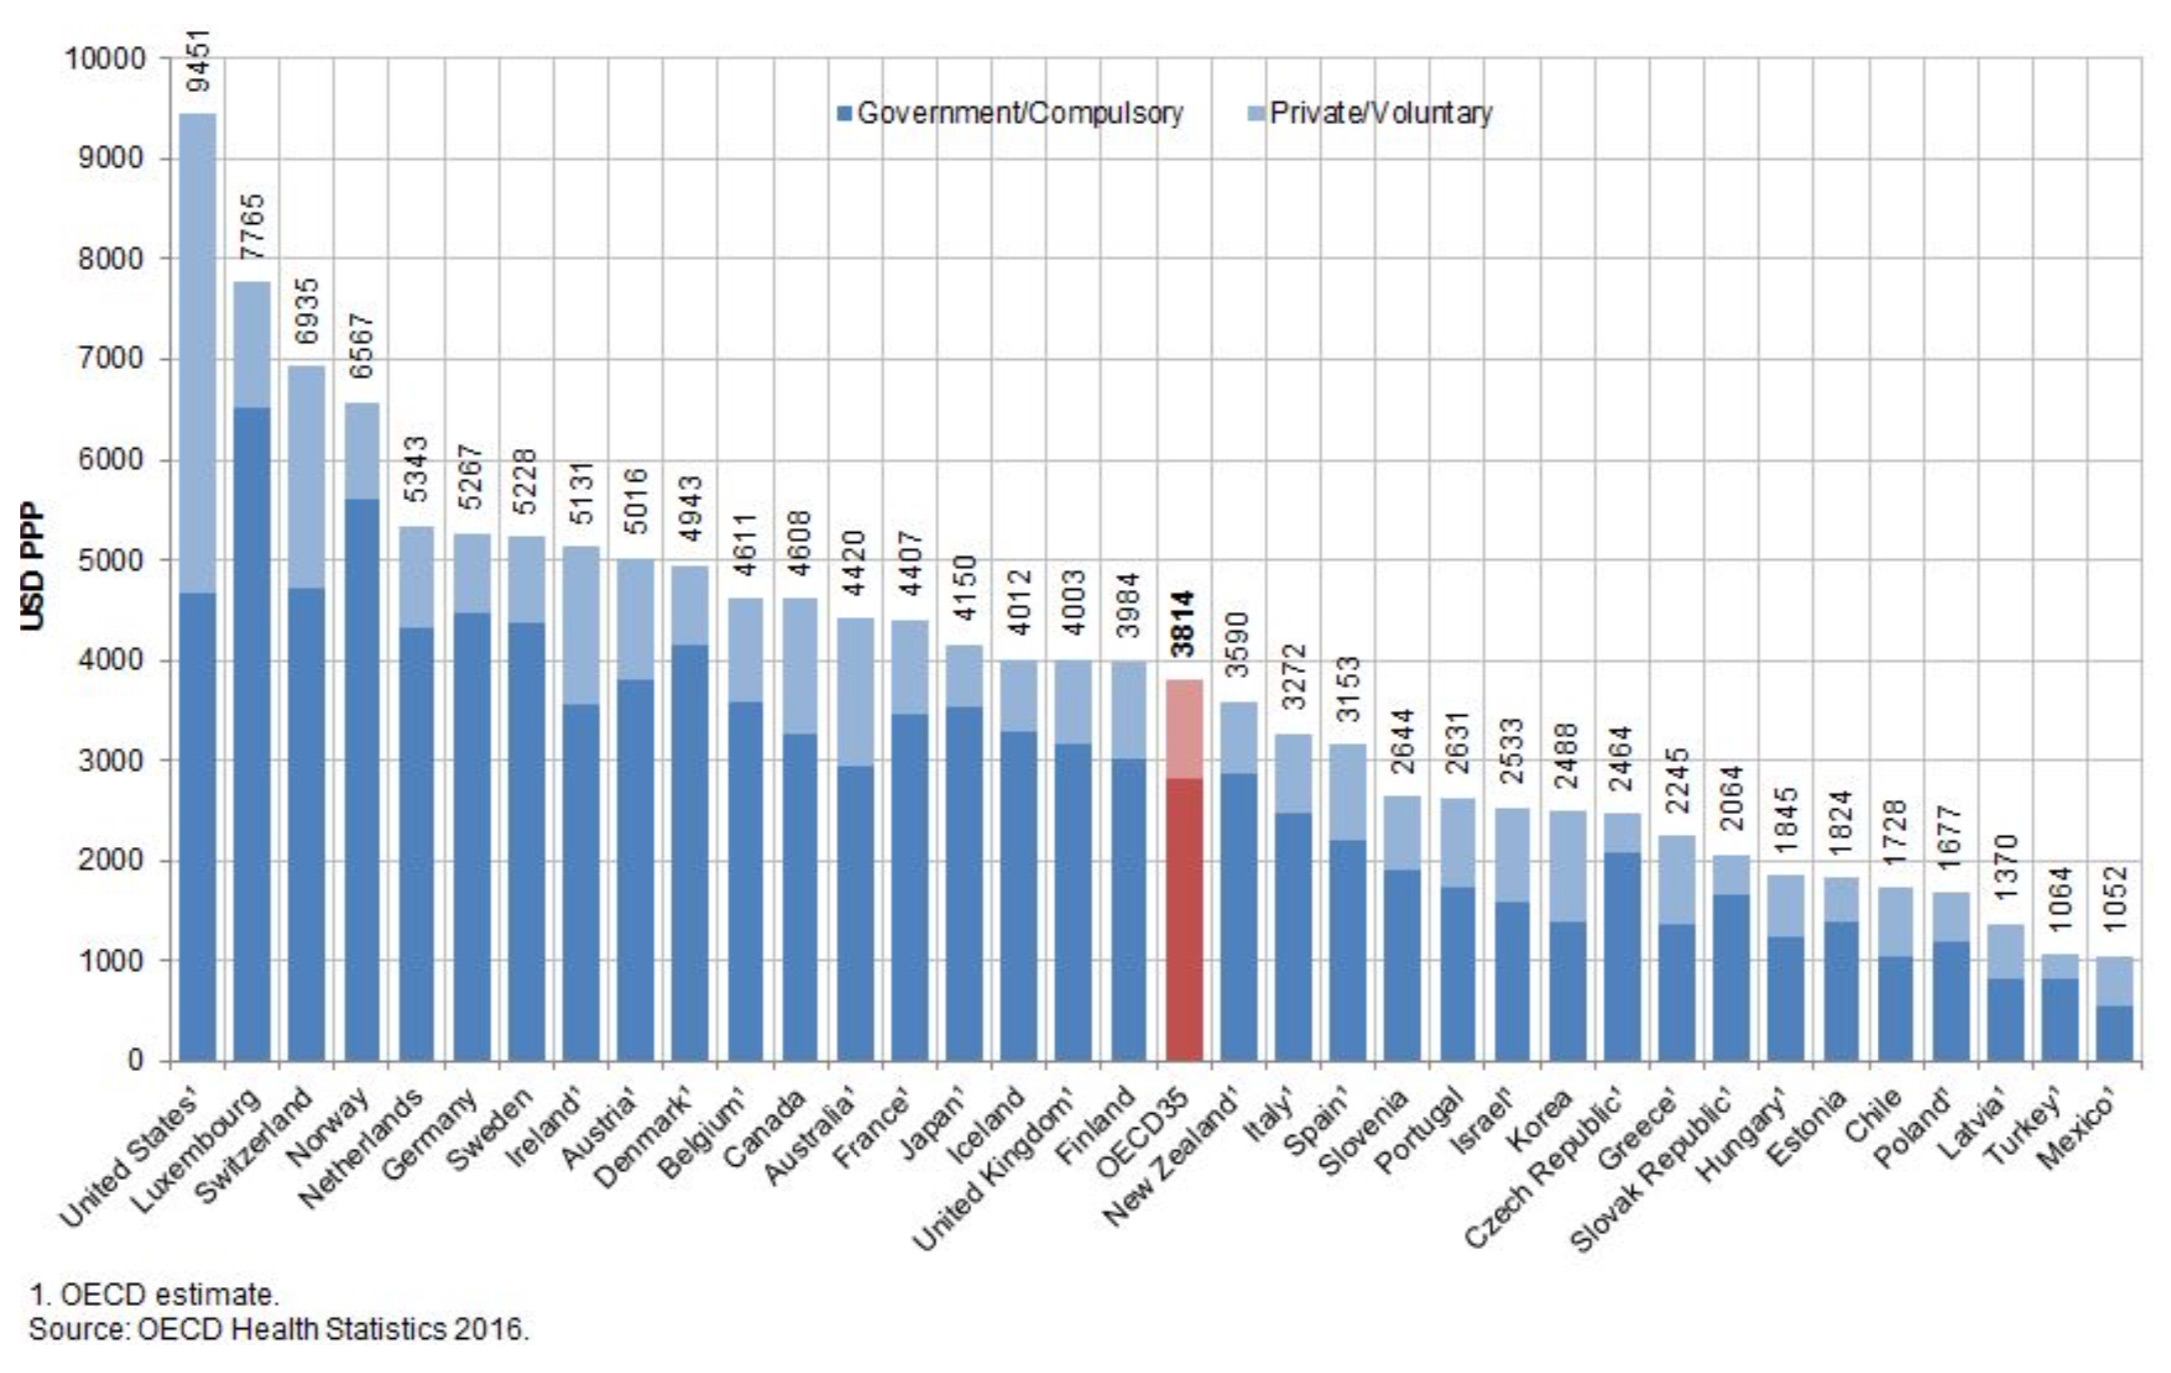
Of these outlays, Social Security, Medicare and Medicaid are (at least in theory) supposed to be funded through separate revenue-raising measures (payroll (FICA) taxes) but are often included in total federal expenditures. This model acknowledges the comparatively poor value American public healthcare costs represent compared to the rest of the developed world (we generally pay more per-person for public healthcare programs that are only available to the poor and elderly than other nations do for healthcare that covers everyone in their society).
However, this model’s focus will not center on the over-payment of public health programs – nor the current state or solvency of Social Security. Instead, it will focus primarily on the expenditures and functions of the United States Federal Government as it exists today. In doing so, we’ll also need to take a look at the revenue it earns over a fiscal year (again in this case for 2018).
For FY2018, the U.S. raised a total of $3.3 trillion – some $800 billion less than it spent (meaning that there remained a “deficit” of $800 billion).
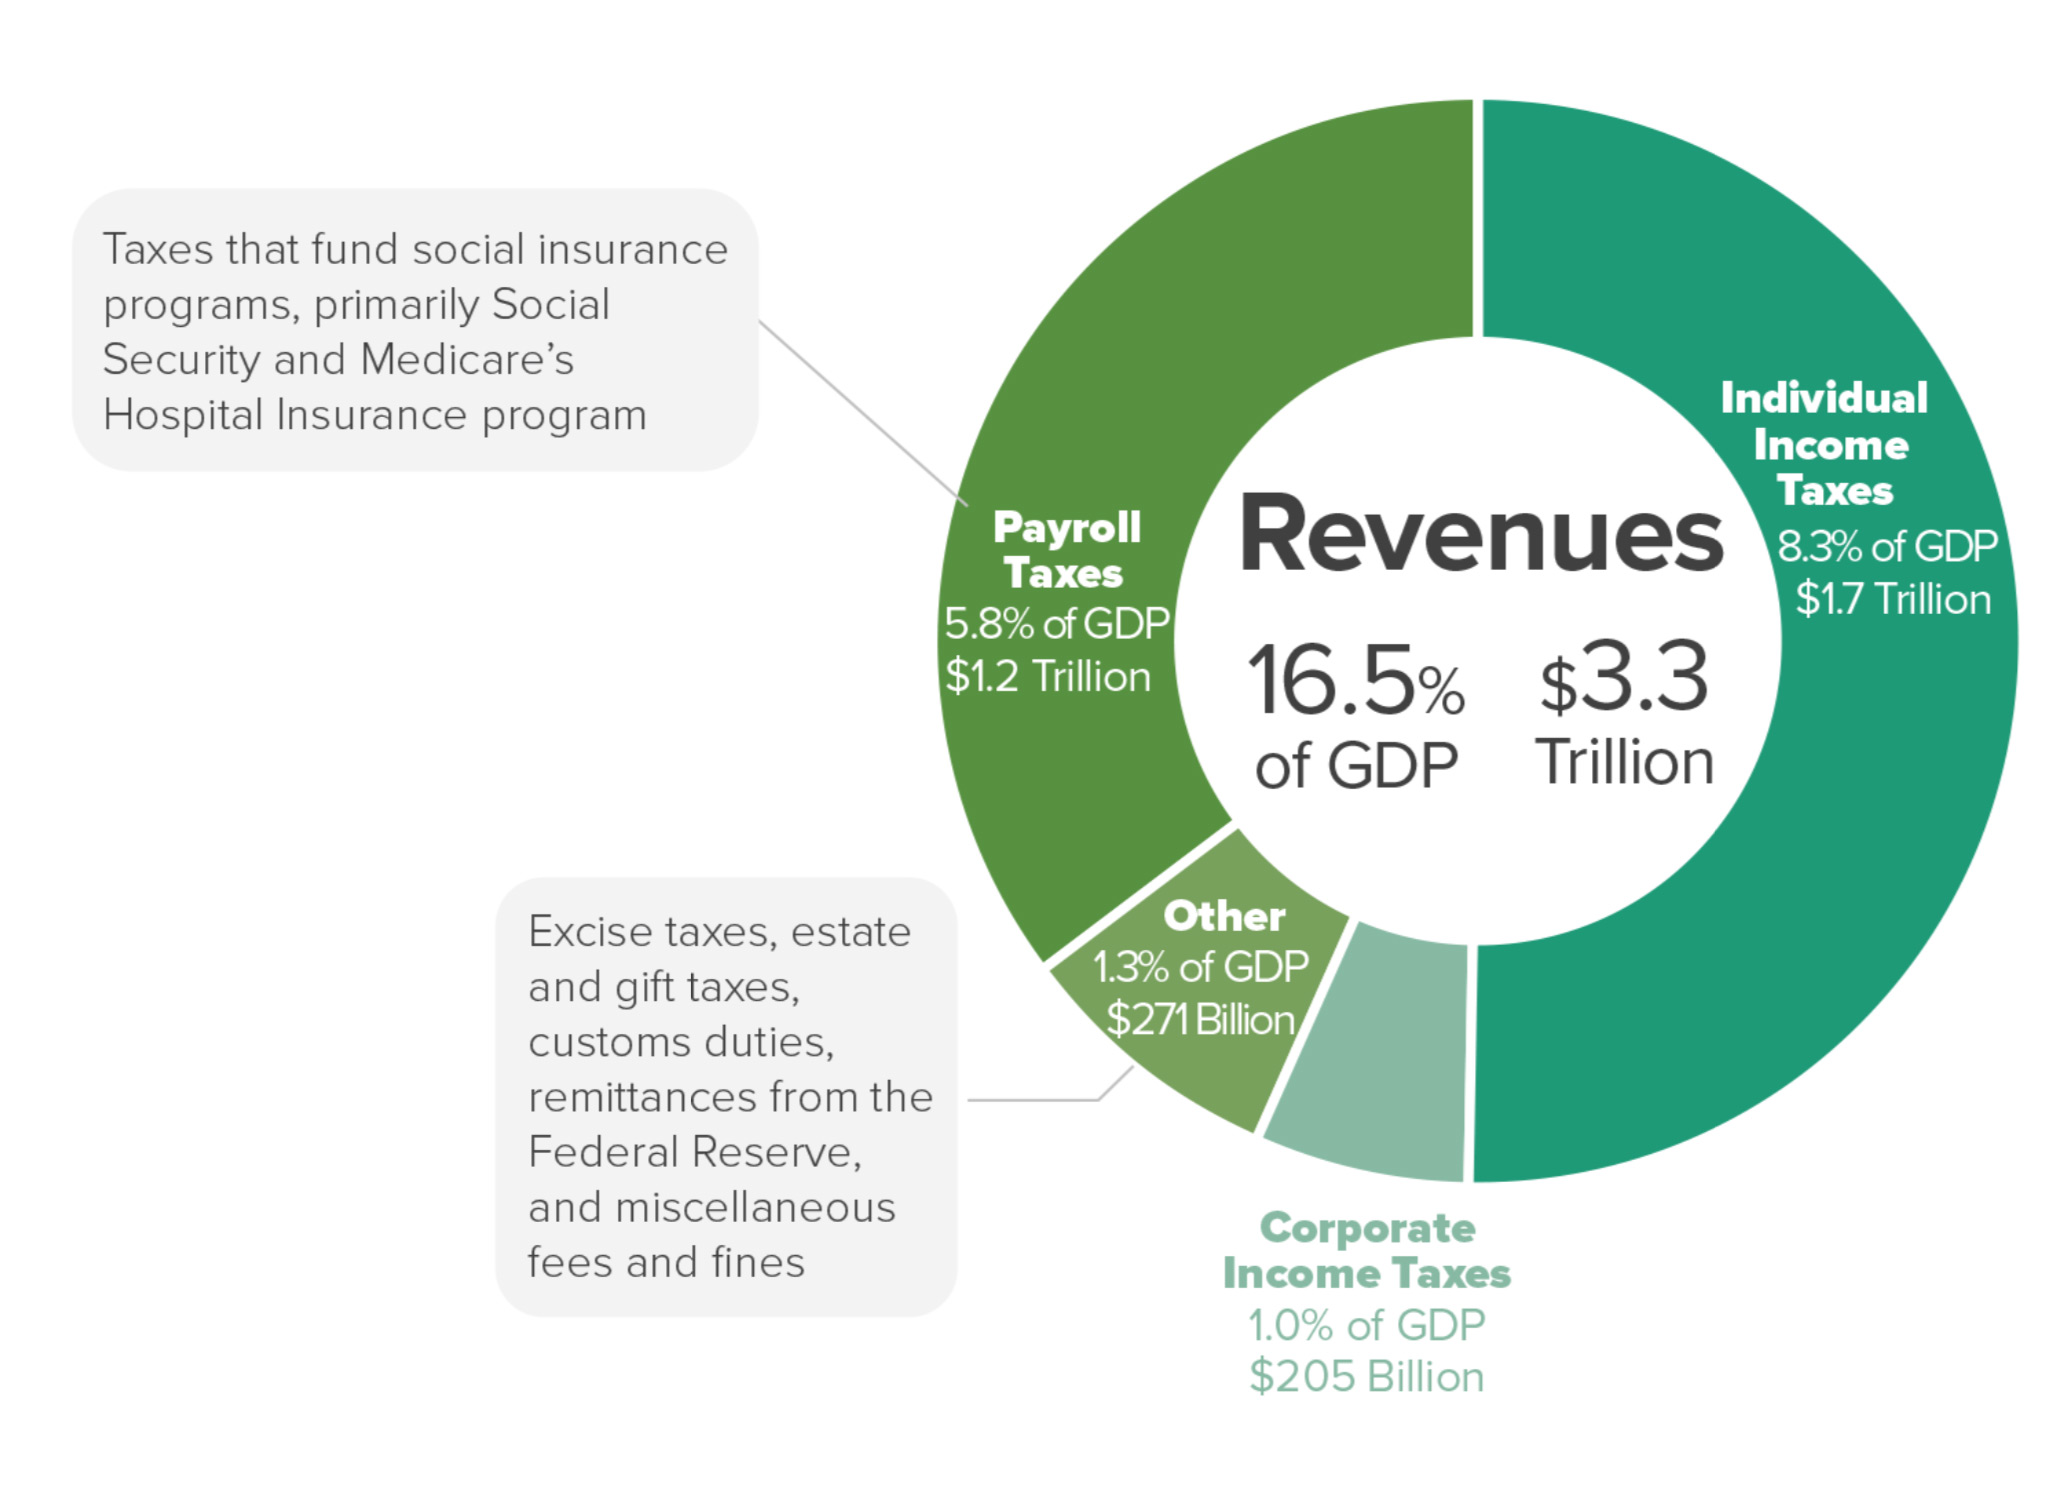
Of this revenue raised, $1.2 trillion was for the “trust-funded” programs of Social Security, Medicare and Medicaid (which we’re not including in this analysis). As these programs are supposed to be funded in full through separate payroll taxes we will break down revenue allocations and deficits thereof by funding source and intended use:
Medicare, Medicare, Medicaid and Social Security:
$1.2 trillion raised.
$1.95 trillion spent.
Deficit: -$750 billion
Other mandatory, defense and discretionary spending:
$2.176 trillion raised.
$2.157 trillion spent.
Surplus: $19 billion
For this analysis, we will assume that the deficit comes primarily from a lack of payroll taxes to fund FICA-related trust programs – not general revenue for the operating functions of the Federal Government. To fill this gap, this model suggests raising payroll taxes accordingly alongside honest and effective investigations into why American public healthcare problems are so exorbitantly overpriced compared to their counterparts abroad. For other federal spending and raising revenue, we will focus on three key areas: defense spending, discretionary spending, and additional revenue, and proceed in that order.
Defense spending. One of the most surprising aspects of the federal budget is how many expenditures earmarked other than “defense” are actually exclusively defense-related costs. For example:
- Veterans affairs, at $186.5 billion for FY2018, is paid out of the discretionary budget.[2]
- Military retiree pay, at $54.7 billion for FY2018, is paid out of the discretionary budget.[3]
- Several other defense-related expenditures ($10.6 billion for nuclear weapons,[4] $44.1 billion for the Department of Homeland Security[5] (which includes Coast Guard and is indisputably a “defense-oriented” expenditure), clandestine intelligence operations ($81+ billion),[6] and foreign military assistance are all paid for out of the discretionary budget.
- Of the $325 billion in national debt interest payments for FY2018 (the total of which is $23 trillion), at least 26% is due from the $6.3 trillion the U.S. government has borrowed to fund the wars in Iraq and Afghanistan, alone.[7] The nonprofit War Resisters League estimates that the total percentage of the current national debt due to war is as high as 80%, though it acknowledges most sources estimate the figure to be approximately half.[8] We will assume this 50% figure in this analysis, arriving at $162.5 billion.
In total, this would come to a total of an additional $539.4 billion in defense-related costs that are billed as “non-defense.” Therefore, our total “defense” spending is actually about $1.163 trillion, as opposed to the $623 billion it’s annually billed as.
Conventional wisdom frequently touches on how much more our nation spends on “defense” compared to the rest of the world – exceeding the total of the next eight nations combined, even though we count six of the eight as allies.
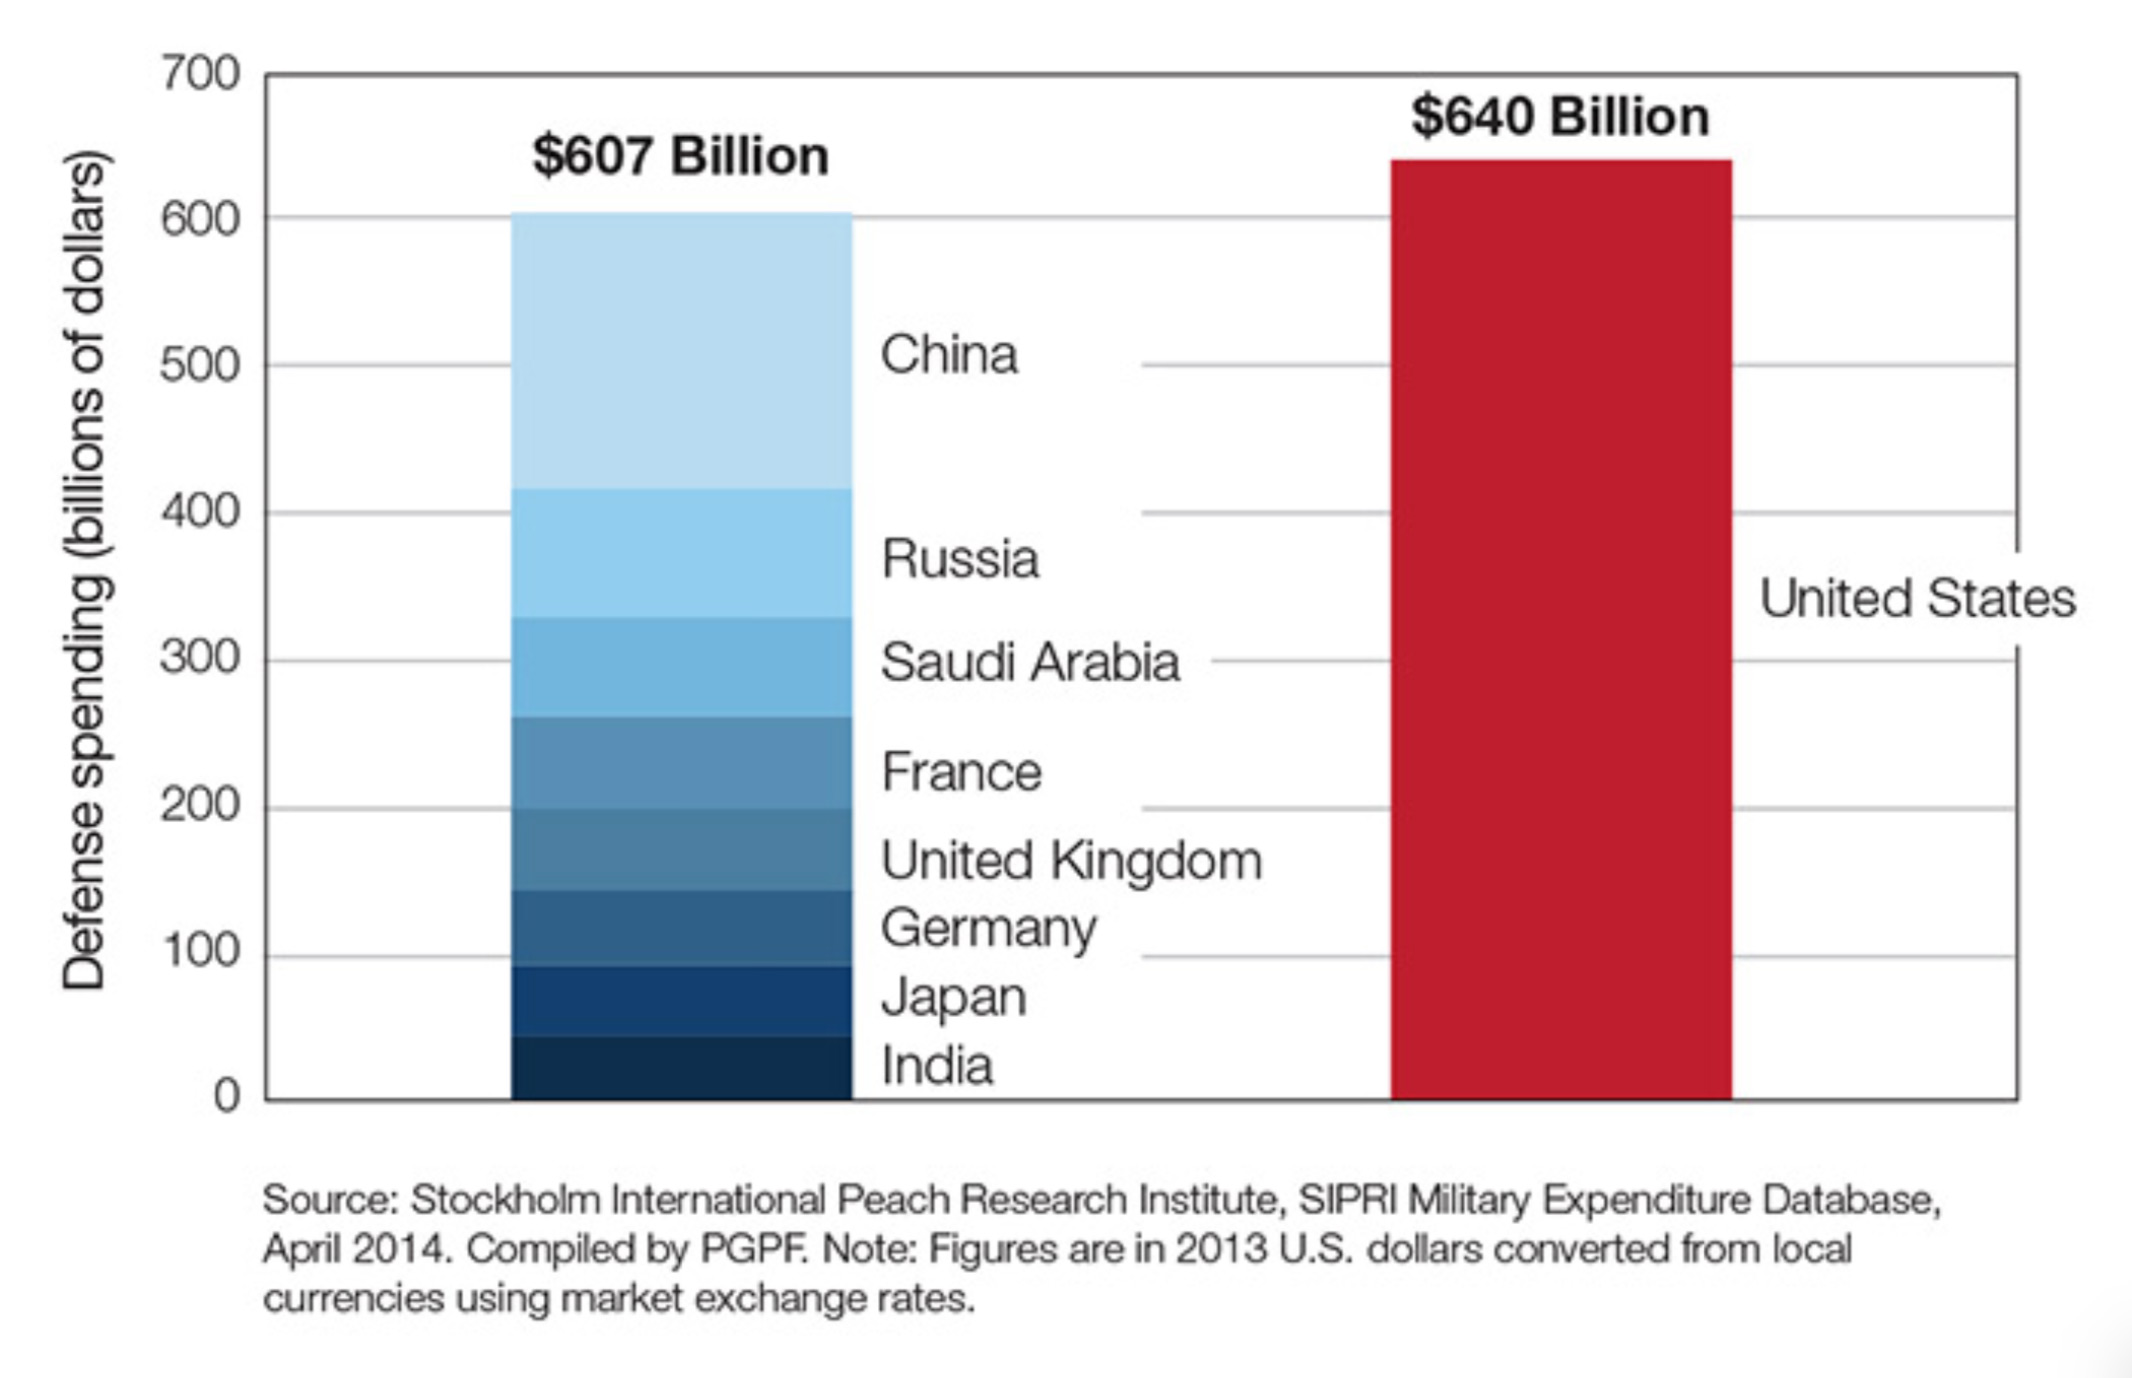
Yet this figure only counts our stated defense spending, whereas our total spending is nearly twice that. This model suggests that investing in a framework that dramatically reduces the underlying need for a global military empire is a far wiser expenditure than wasting endless trillions on military technologies that eventually become obsolete as future conflicts evolve. Consequently, this model assumes that through a mixture of honest accounting, scaling down the mandate and global deployment scope of our military, and ensuring all military costs are paid through the defense budget, we could be able to pare off $350 billion annually from our $1.163 total military expenditure (a 30% reduction that would still make us spend more than the next eight nations combined).
Subtotal savings from total military spending: $350 billion.
Discretionary spending. While much of the discretionary budget are actually military-related expenditures, there remain valid concerns about the scale of redundancy within federal bureaucracy. This writing does not maintain an ideological position on the scope of the Federal Government, yet it does suggest addressing manifestations of operational and organizational lapses through redundant services. For example:
- There are at least 65 agencies empowered with enforcing various aspects of federal law.[9]
- There are more than 451 independent federal agencies tasked with various aspects of societal management with the power to independently enact regulations across all areas of our society. [10]
- There are seventeen independent intelligence agencies within the United States Intelligence Community.[11]
In mention, it’s important to emphasize that this isn’t an indictment of the functions of government, the use of regulation, or the need for intelligence. Rather, the concern is that these agencies serve functions that are a) independently operated, b) redundant in focus, and c) largely shared by counterparts at the state level. This, in aggregate, presents an amplified cost basis for their functions that make the discretionary functions of government cost much more than they would need to if a streamlined approach between federal and state services were facilitated.
Indeed, the aggregate sum of the discretionary spending of the Federal Government, at some $6.3 trillion per decade, is effectively the cost of implementing Scarcity Zero in entirety. It’s difficult to see how that has delivered a comparable social value, or any empirical value, for that matter.
This model suggests that through bureaucratic restructuring to consolidate agencies and reduce redundancy, end socially harmful and wasteful programs like the “War on Drugs” and place greater reliance on partnerships with already-functioning agencies at the state level, that we could reduce the discretionary spending of the Federal Government by approximately 25%. This would raise a total of $159.75 billion.